Statistics in the Workflows sidebar shows how often your workflows ran, what they cost and how reliably they succeeded. Each workflow also has its own statistics page.
Overview Metrics
The page Workflow Statistics opens on the last 30 days. Change the period with the date range picker; it reaches back up to 90 days, because runs are deleted 90 days after they finish.
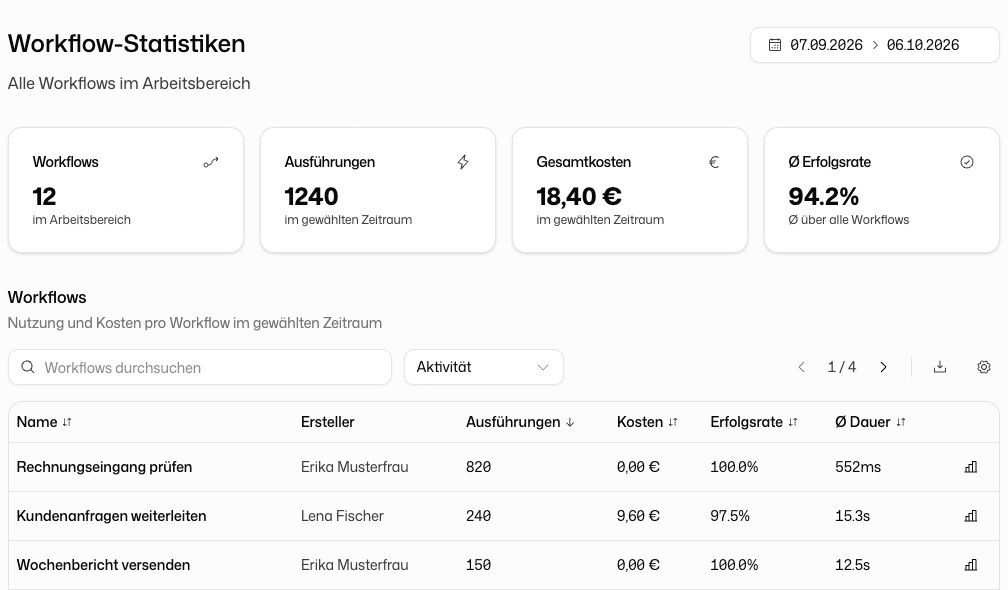
| Card | Meaning |
|---|---|
| Workflows | Number of workflows in scope |
| Executions | Runs in the selected period |
| Total cost | Cost of all runs in the period |
| Avg. success rate | Average across all workflows that ran in the period |
If your role may read users, you can switch between All Workflows in Workspace and My Workflows. Otherwise you see your own workflows only.
Workflow Table
Below the cards, a table lists each workflow with its figures for the period:
| Column | Description |
|---|---|
| Name | The workflow |
| Creator | Who created it, in the workspace view |
| Executions | Runs in the period |
| Cost | Total cost in the period |
| Success rate | Share of runs without error |
| Avg. duration | Average duration of a run |
| Details | Opens the workflow's own statistics |
Use Search workflows to find one by name, and the Activity filter to show only workflows With executions or with No executions.
Per-Workflow Stats
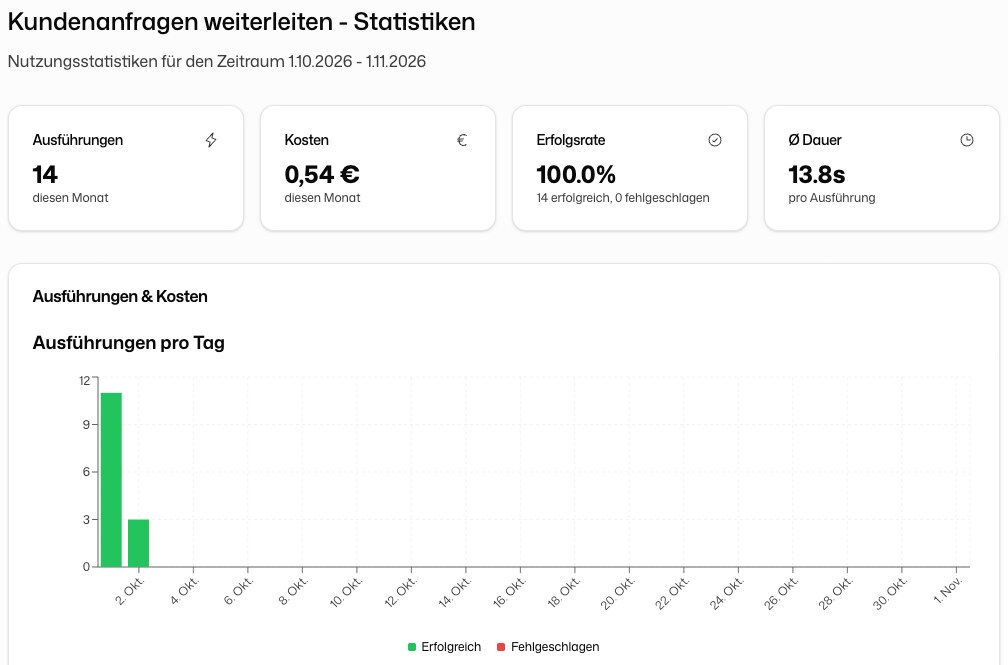
The statistics of a single workflow open from Details in the table or from Statistics in the workflow card's menu. They show:
- Executions this month, Cost, Success rate with the number of successful and failed runs, and Avg. duration per execution
- the chart Executions & Costs with executions and cost per day
- Token usage by model: input and output tokens and cost per model
- Recent executions with date, status, duration and cost
Open builder takes you to the workflow.