Workflow Builder
The canvas, node picker, testing, versions, settings and sharing in the workflow builder
The builder is where you design, test and deploy a workflow. Open a workflow from the overview, or create one with New Workflow.
Layout
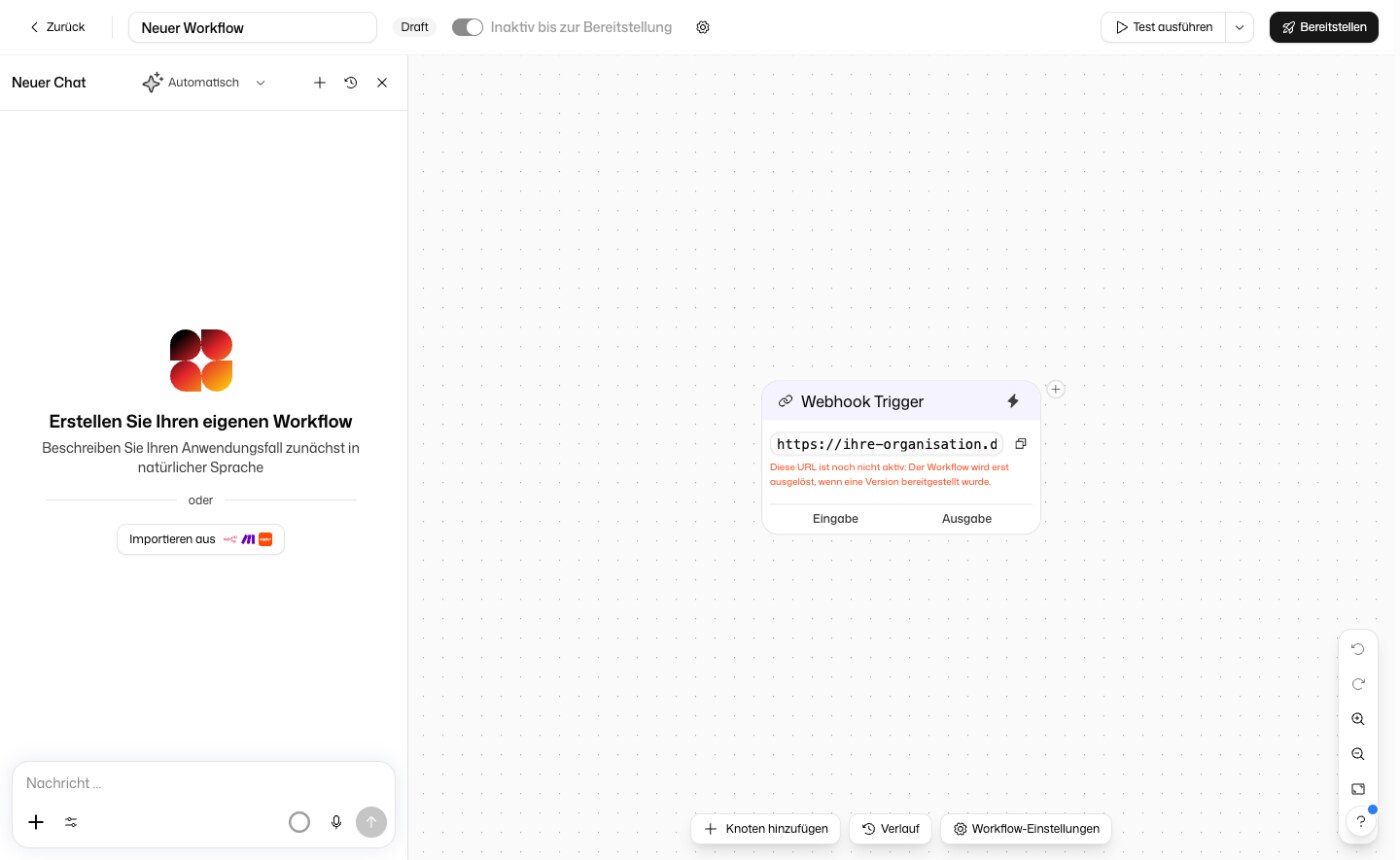
| Area | Location | Purpose |
|---|---|---|
| Header | Top | Workflow name, status, the Active switch, the gear for Workflow settings, save status, Run test and Deploy |
| AI chat | Left, collapsible | Opens from the round sparkle button at the bottom left. Builds and edits the workflow from plain-language instructions |
| Canvas | Center | Nodes and the edges between them |
| Node panel | Right | Opens when you select a node and shows its configuration |
| Bottom bar | Bottom center | Add node, History, Clear all pins (only when data is pinned) and Workflow settings |
| Canvas controls | Bottom right | Undo, Redo, Zoom in, Zoom out, Center view and Arrange nodes |
Changes are saved automatically. The save status next to the gear shows when that has happened. If a node holds a setting that cannot be saved, for example an agent tool whose configuration is no longer valid, the status shows Not saved and a message on the canvas names the node. Until that node is fixed, no change to the workflow is saved; Open node takes you there, and selecting the marked tool again fixes it.
Canvas
| Action | Input |
|---|---|
| Pan | Drag on empty space |
| Zoom | Scroll wheel or trackpad pinch, or Zoom in / Zoom out |
| Fit everything | Center view in the canvas controls |
| Tidy up | Arrange nodes lays the nodes out automatically |
| Select several nodes | Hold Shift and drag a selection box |
| Delete selection | Backspace |
To connect two nodes, drag from the output handle of one node to the input handle of the next.
Adding Nodes
Click Add node in the bottom bar to open the node picker. Type to search across all nodes, or browse the categories:
- Triggers: the starting point of a workflow. Integration Triggers lists the events of connected services.
- Actions: HTTP Request, Web Search, Delay, RSS Feed, Code and Image Generation
- Agents: the AI Agent
- Flow: Condition, Loop and Subworkflow
- Integrations: the actions of every integration, plus the sub-views Data Tables and Secret Stores
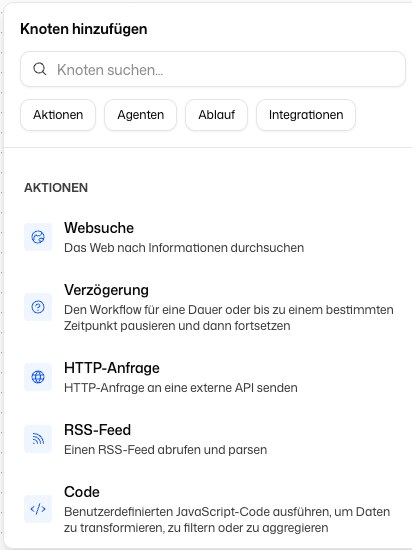
Details on each node: Triggers, Action nodes, AI Agent.
Configuring a Node
Click a node to open its panel on the right. Depending on the node type it shows:
- the node's label, which you can rename
- Connection for integration nodes, with a link to Manage connections
- Inputs, each with an input mode: Manual (a fixed value or variables), AI Prompt (an AI model generates the value from your prompt), Auto (the AI decides) or Empty. Some fields also offer Select to pick from a list
- Advanced settings
- Error handling: Stop workflow ends the run when the node fails. Use error output activates the node's error output instead, so the workflow can continue along another path
- Approval required: pauses the run before this node until someone approves. See Approvals
- Pinned data: see below
The panel header has a button for Replace node, and Delete node sits at the bottom of the panel. Right-click a node on the canvas for Duplicate node.
Variables
Click into an input field and the Variables panel opens beside it, listing the outputs of all upstream nodes. Click Insert or drag a variable into an input. The inserted path looks like {{nodeName.outputs.fieldName}}, where nodeName is the variable name the node got from its title.
Testing and Pinned Data
Click Run test in the header. The arrow next to it offers Test (use test data), which reuses pinned data, and Fresh test (ignore all data), which runs every node.
Pinned data replaces a node's output during tests, so expensive or slow nodes do not run again and again:
- On a trigger, create test data with Create form test data, Create webhook test data or, for integration triggers, Get test event, which fetches a real event from the service.
- On any node, use Pin data in its panel.
- In the execution history, Pin data pins the outputs of all completed nodes of that run.
Clear all pins in the bottom bar removes every pin at once.
Each node on the canvas also has a button to test from that node onward. It reuses the last execution or pinned data for everything before it, so run the full workflow once or pin data first.
Deploying and Versions
A workflow's triggers only fire after you deploy a version. Click Deploy, pick Patch, Minor or Major, enter a Description (required) and click Deploy version v…. The popover lists the Changes since the last version and any errors it found in the workflow.
Under Previous versions you see every deployed version. Click one to restore it. Unsaved changes are lost when you restore.
The switch in the header turns a deployed workflow Active or Inactive. Before the first deployment it reads Inactive until published.
Workflow Settings
The gear opens Workflow settings. They apply to this one workflow.
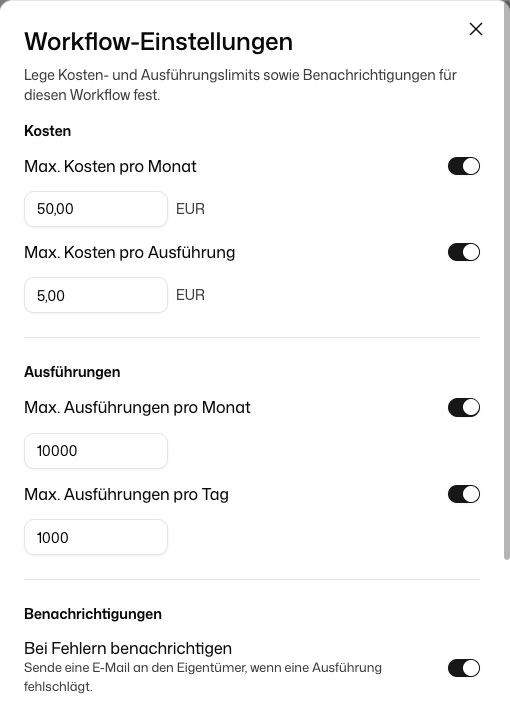
| Setting | Default | What it does |
|---|---|---|
| Max. cost per month | €50 | Further runs are refused once the workflow has spent this much in the calendar month |
| Max. cost per execution | €5 | A run that exceeds it is stopped mid-run |
| Max. runs per month | 10,000 | Further runs are refused for the rest of the month |
| Max. runs per day | 1,000 | Further runs are refused for the rest of the day |
| Notify on failure | On | Emails the owner when a run fails. Additional recipients must be members of your organization |
| Max. emails per day | 1 | Caps the failure emails per day |
Setting a cost limit to 0 removes it. Your organization can set a ceiling that these limits cannot exceed; see Budgets & Limits.
Execution History
Click History in the bottom bar. The Execution history lists past runs with status, duration and cost. Select a run to see the node flow and, per node, its inputs, outputs, log and error.
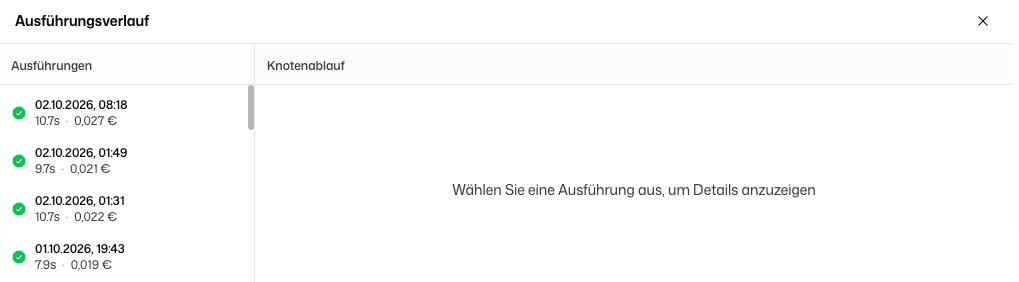
While a past run is shown, a read-only notice appears in the header and you cannot edit. Close the panel to return. History is not available while a run is in progress.
A run is deleted 90 days after it finished, together with the files it received or produced (for example form uploads). A run that is still waiting, for an approval or a Delay, is kept until it finishes. Billing is not affected.
AI Chat Assistant
Click the sparkle button at the bottom left to open the assistant. It can build a workflow from a description, change nodes, run tests and explain errors. You can also paste an export from Zapier, n8n or Make into the chat to have it converted.
The assistant counts against your licence like the regular chat, not against the workflow budget. Details in Billing.
The assistant works on the workflow that is open. Asked for a change, it builds or edits the workflow itself: it adds and connects nodes, sets up connections, runs tests and sets restore points you can roll back to. Beyond that it can do what the main chat can: search the web, use agent mode with your connected integrations, generate images, use skills and take file uploads. So "search the web for the API docs and build a workflow that…" works in one message.
Something the assistant does through an integration in the chat happens once, right now. A step that should happen on every run has to be a node in the workflow.
Sharing, Exporting and Duplicating
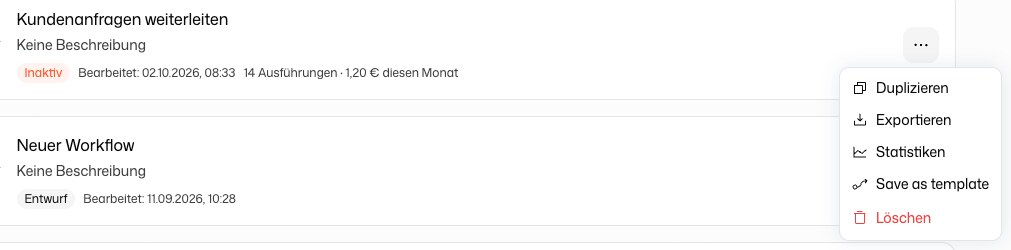
The ⋯ menu on each workflow card in the overview holds:
- Duplicate: creates a copy.
- Export: downloads the workflow as a JSON file. Import Workflow on the overview reads such a file back in.
- Statistics: opens the workflow's statistics.
- Share: lets you give groups or individual users Edit, Read or No access. This entry only appears on workflows you own, in an organization, and when your role has the permission to share workflows. Otherwise the menu has no Share.
- Save as template: see Templates.
- Delete: removes the workflow after a confirmation.
When you share a workflow, the integration connections it uses are shared with it, but only for running this workflow. The dialog lists those connections and shows whether each is also Shared outside the workflow. Workflows others share with you appear in the Shared with me tab.
Keyboard Shortcuts
| Shortcut | Action |
|---|---|
Ctrl/Cmd + Z | Undo |
Ctrl/Cmd + Y or Ctrl/Cmd + Shift + Z | Redo |
Ctrl/Cmd + C | Copy selected nodes |
Ctrl/Cmd + V | Paste nodes |
Backspace | Delete selected node or edge |
Shortcuts do not act while the cursor is in an input field.